30

Given the option:

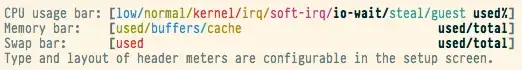
[ ] Detailed CPU time (System/IO-Wait/Hard-IRQ/Soft-IRQ/Steal/Guest)

In htop (Version 1.0.1) what are the meanings of the colours?

In the following image, I'm seeing rather a lot of what I expect is IO-Wait, but where does one determine the meaning of the colours.

htop screenshot demonstrating colours

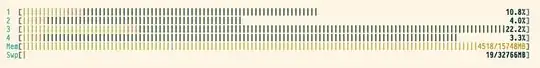
Naturally this depends on the htop colour theme in use (default) and the terminal color scheme (solarized light here), but is there a reference?

Note: This normally happens to my server right before it dies, so I thought I'd ask whilst I have some time waiting for the box to recover.

Stephen Rauch
  • 4,209
  • 14
  • 22
  • 32
Lee Hambley
  • 405
  • 1
  • 4
  • 7
  • Good question, just looking at it now, and wondering WTF it is trying to tell me. – Tim Oct 09 '12 at 17:08

1 Answers1

28

F1 or h will show you the legend.

It looks like in this color scheme:

CPU:

  • blue is for low priority threads
  • green is normal priority threads
  • black is for io-wait

see below for more.

Memory:

  • green is memory in use
  • blue is buffer
  • orange is cache

htop color legend

h3rrmiller
  • 13,095
  • 5
  • 31
  • 41