7

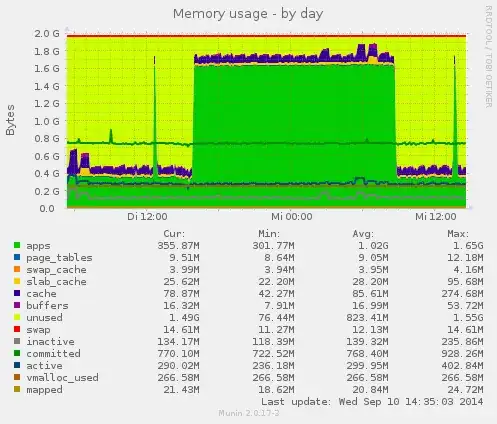
For a while, I encounter RAM-shortages on my Debian webserver (VPS/virtual machine). This would not be unusual, if they happend on a regular basis. But they do not. Here's a chart from Munin:

                 Daily memory use, by munin

To solve such riddles, I tracked my system with atop. Here're two snapshots from 7:00AM and 9:00AM - during and after the RAM shortage (using the -m option to see the memory-related information):

ATOP - <snip>                           2014/09/10  07:00:02                           ------                             10m0s elapsed
<snip>
MEM |  tot     2.0G |  free   79.1M  | cache 102.4M  |  dirty   0.1M |  buff   53.2M  |  slab   90.8M |                |               |
SWP |  tot     2.0G |  free    2.0G  |               |               |                |               |  vmcom 748.1M  | vmlim   3.0G  |
DSK |           sda |  busy      1%  | read     917  |  write   1695 |  KiB/w     13  |  MBr/s   0.01 |  MBw/s   0.04  | avio 1.22 ms  |
<snip>

  PID     MINFLT     MAJFLT     VSTEXT      VSIZE      RSIZE      VGROW      RGROW     RUID         EUID          MEM     CMD       1/15
13717        102         18     10709K     874.5M     206.2M         0K       128K     mysql        mysql         10%     mysqld
 4086        166          0       450K     228.1M     21896K         0K         0K     www-data     www-data       1%     apache2
19131       1659         99       450K     225.5M     19604K     -2652K     -2292K     www-data     www-data       1%     apache2
 1469        608          0       450K     222.6M     18508K       256K        64K     www-data     www-data       1%     apache2
23038        347          0       450K     222.3M     18496K         0K         0K     www-data     www-data       1%     apache2
 4085        721          0       450K     222.1M     18308K         0K         0K     www-data     www-data       1%     apache2
10639        790          0       450K     224.9M     18284K       768K       932K     www-data     www-data       1%     apache2
19158        199          1       450K     222.1M     18064K         0K        52K     www-data     www-data       1%     apache2
 1895        330          0       450K     221.8M     18020K         0K         0K     www-data     www-data       1%     apache2
 6661       3346         22       450K     224.0M     17700K      1512K      -780K     www-data     www-data       1%     apache2
12570        808          0       450K     221.7M     17668K       512K       508K     www-data     www-data       1%     apache2
19817          0          0       450K     214.5M     15336K         0K         0K     root         root           1%     apache2
18209       3996          0      2277K     55592K     14728K     55592K     14728K     till         till           1%     python
18210       2760          0         4K     43292K     10544K     43292K     10544K     munin        munin          1%     munin-update
11976        506          0       149K     18788K      6512K         0K         0K     root         root           0%     atop
 1934        175          0         4K     52228K      5852K         0K         0K     root         root           0%     munin-node
17993          0          0         4K     67020K      5712K         0K         0K     postgrey     postgrey       0%     /usr/sbin/post
 2000          0          0       346K     244.3M      5668K         0K         0K     root         root           0%     rsyslogd
14557          0          0      7163K     234.9M      5284K         0K         0K     root         root           0%     php5-fpm
14558          0          0      7163K     234.9M      4564K         0K         0K     www-data     www-data       0%     php5-fpm
14559          0          0      7163K     234.9M      4564K         0K         0K     www-data     www-data       0%     php5-fpm
  328          0          0       134K     572.6M      2932K         0K         0K     root         root           0%     console-kit-da
<snip>

And...

ATOP - vmd1989                           2014/09/10  09:00:02                           ------                             10m0s elapsed
<snip>
MEM |  tot     2.0G |  free    1.5G  | cache  88.8M  |  dirty   0.1M |  buff   19.2M  |  slab   25.8M |                |               |
SWP |  tot     2.0G |  free    2.0G  |               |               |                |               |  vmcom 748.0M  | vmlim   3.0G  |
DSK |           sda |  busy      0%  | read     453  |  write   1991 |  KiB/w     12  |  MBr/s   0.01 |  MBw/s   0.04  | avio 1.01 ms  |
<snip>

  PID     MINFLT     MAJFLT     VSTEXT      VSIZE      RSIZE      VGROW      RGROW     RUID         EUID          MEM     CMD       1/16
13717        189          0     10709K     874.5M     206.3M         0K         0K     mysql        mysql         10%     mysqld
23038        743          7       450K     222.6M     18620K         0K        40K     www-data     www-data       1%     apache2
23930        692          0       450K     220.6M     18568K         0K         0K     www-data     www-data       1%     apache2
28738       4784          0         4K     126.4M     18328K     126.4M     18328K     munin        munin          1%     munin-update
26990        392          1       450K     220.5M     18088K         0K       112K     www-data     www-data       1%     apache2
26552       1150          2       450K     220.3M     17788K       512K       576K     www-data     www-data       1%     apache2
28744       1443          0         4K     129.1M     17636K     129.1M     17636K     munin        munin          1%     /usr/share/mun
27424        602          0       450K     219.8M     17504K         8K       240K     www-data     www-data       1%     apache2
27000        216          0       450K     219.8M     17308K         8K       104K     www-data     www-data       1%     apache2
28290       2977          0       450K     219.9M     17200K     219.9M     17200K     www-data     www-data       1%     apache2
19817         68          0       450K     214.5M     15340K         0K         0K     root         root           1%     apache2
28287        429          1       450K     215.0M     10384K     215.0M     10384K     www-data     www-data       1%     apache2
28727        184          0       450K     214.5M      9300K     214.5M      9300K     www-data     www-data       0%     apache2
28728        191          0       450K     214.5M      9300K     214.5M      9300K     www-data     www-data       0%     apache2
11976        490          0       149K     18788K      6512K         0K         0K     root         root           0%     atop
 1934        428          0         4K     52228K      5852K         0K         0K     root         root           0%     munin-node
 2000          0          0       346K     244.3M      5668K         0K         0K     root         root           0%     rsyslogd
28745       1036          0         4K     52228K      5580K     52228K      5580K     root         root           0%     munin-node [::
14557          0          0      7163K     234.9M      5284K         0K         0K     root         root           0%     php5-fpm
17993          0          0         4K     67020K      4844K         0K         0K     postgrey     postgrey       0%     /usr/sbin/post
14558          0          0      7163K     234.9M      4564K         0K         0K     www-data     www-data       0%     php5-fpm
14559          0          0      7163K     234.9M      4564K         0K         0K     www-data     www-data       0%     php5-fpm
  328          0          0       134K     572.6M      2932K         0K         0K     root         root           0%     console-kit-da
<snip>

Sorry for the long lists - just do not want to miss the cause. Yet, my problem is: I do not see the cause. There is significantly less "free" memory in the status (top), but no process that would explain why, where is the memory going...

Is my thinking incorrect with this?

Update

According to Patrick's advice, I collected /proc/meminfo - during a phase of RAM shortage and later. In sake of easy visibility, I put the content into one table:

               mem-shortage   a bit later

MemTotal:        2060776 kB    2060776 kB
MemFree:          252896 kB    1608532 kB   *
Buffers:           15464 kB      12060 kB
Cached:            71864 kB      62800 kB
SwapCached:         4160 kB       4160 kB
Active:           268020 kB     253368 kB
Inactive:         134988 kB     132300 kB
Active(anon):     225940 kB     220872 kB
Inactive(anon):    97296 kB     220872 kB   *
Active(file):      42080 kB      32496 kB
Inactive(file):    37692 kB      29116 kB
Unevictable:        6540 kB       6680 kB
Mlocked:            6540 kB       6680 kB
SwapTotal:       2096476 kB    2096476 kB
SwapFree:        2081568 kB    2081568 kB
Dirty:                 0 kB        116 kB
Writeback:             0 kB          0 kB
AnonPages:        318084 kB     313364 kB
Mapped:            20692 kB      20408 kB
Shmem:              4208 kB       9896 kB
Slab:              24336 kB      23936 kB
SReclaimable:      10252 kB       9316 kB
SUnreclaim:        14084 kB      14620 kB
KernelStack:        1464 kB       1544 kB
PageTables:         8396 kB       9544 kB
NFS_Unstable:          0 kB          0 kB
Bounce:                0 kB          0 kB
WritebackTmp:          0 kB          0 kB
CommitLimit:     3126864 kB    3126864 kB
Committed_AS:     744764 kB     761812 kB
VmallocTotal:   34359738367 kB  34359738367 kB
VmallocUsed:         272976 kB       272976 kB
VmallocChunk:   34359464431 kB  34359464431 kB
HardwareCorrupted:     0 kB          0 kB
AnonHugePages:         0 kB          0 kB
HugePages_Total:       0             0
HugePages_Free:        0             0
HugePages_Rsvd:        0             0
HugePages_Surp:        0             0
Hugepagesize:       2048 kB       2048 kB
DirectMap4k:      282560 kB     282560 kB
DirectMap2M:     1814528 kB    1814528 kB

I only see two signficant (not in the statistical sense) differences, marked with an asterisk (*), but I do not think, they tell me where the RAM went.

I also checked for shared memory (as good as I could) ... and found none.

# ipcs -m

------ Shared Memory Segments --------
key        shmid      owner      perms      bytes      nattch     status

I also check for hidden processes using unhide. But except for a false positive (known issue with Debian), there seem not to be any hidden processes.

Any more ideas why 1.2 GB RAM are in use - and then not? Could this be another issue caused by the virtual server architecture?

Update

I followed Sergio's hint to consult lsmod and check for memory ballooning. The size column does not tell anything helpful, but there's a process vmw_balloon - so it seems to actually be an issue of shifting memory between the virtual machines. Question answered :)

# During high RAM usage (removed middle part)
$ lsmod | sort -r -k 2,2n
Module                  Size  Used by
crc16                  12343  1 ext4
crc_t10dif             12348  1 sd_mod
libcrc32c              12426  2 xfs,btrfs
mperf                  12453  0
ata_generic            12490  0
pcspkr                 12632  0
vmw_balloon            12657  0           <=
ac                     12668  0
i2c_piix4              12704  0
coretemp               12898  0
<snip>
reiserfs              193501  0
drm                   211856  2 ttm,vmwgfx
ext4                  381419  1
xfs                   628913  0
btrfs                 641551  0
BurninLeo
  • 633
  • 1
  • 5
  • 9
  • 2
    I don't know exactly what munin is measuring for "apps", but this could be shared memory. Shared memory won't be associated with any one application, so utils like `top` won't report it as such. Can you capture `/proc/meminfo` during and not-during the issue? – phemmer Sep 10 '14 at 13:01
  • Try to use [smem](http://www.selenic.com/smem/) utility (`apt-get install smem`). – loooser Sep 10 '14 at 13:44
  • @looser: smem seems to focus on graphical reporting. As my only access to the virtual server is the console, I shall not install 59 additional packages, smem requires. Does `smem` actually tell any more, compared to the information I already see? – BurninLeo Sep 12 '14 at 12:30
  • @Patrick: Thanks for the idea. I encountered another RAM shortage today, so I could add new information to my questions. What's your interpretation of my `/proc/meminfo`? – BurninLeo Sep 12 '14 at 12:31
  • @BurninLeo That's good information. Unfortunately I'm not sure the answer. The numbers for data used only add up to around a third of the the memory missing in `MemFree`. This confuses me. This could be due to hyper-virtualization, but I've never really looked into how memory management is handled in hyper-virtualization. – phemmer Sep 12 '14 at 14:10
  • Err, paravirtualization, not hyper-virtualization. Paravirtualization ties into the OS kernel a little bit for better performance, rather than emulating the full hardware stack. – phemmer Sep 12 '14 at 14:24

1 Answers1

3

Probably your virtual machine is suffering some kind of memory ballooning operation ordered from the virtualization platform. You can try to confirm this by looking for a related module with lsmod (the name changes from one virtualization platform to another, but it should be pretty distinctive).

When memory ballooning is enabled, a virtualization Host can move memory resources from one VM to another, when needed. At the request of said Host, the kernel module from the Guest reserves the indicated amount of physical RAM (physical from the viewpoint of OS running on the Guest), to be sure that no other process can make use of it. Then the Host reassigns the real physical resources to another Guest.

The effect on the Guest is exactly what you're seeing, a lot of memory used memory with no apparent owner.

If you don't have control of that virtualization platform, you should ask your provider for information about the actual configuration of the ballooning parameters for your virtual machine.

  • That's in interesting thing, you're talking about. I did not have another RAM surge for a few days, but I will check `lsmod` as soon as the problem returns. I guess, I will have to look for a large value in the column `size`? – BurninLeo Sep 18 '14 at 18:48