4

So using gnuplot, and my code looks like this:

set isosamples 40
unset key
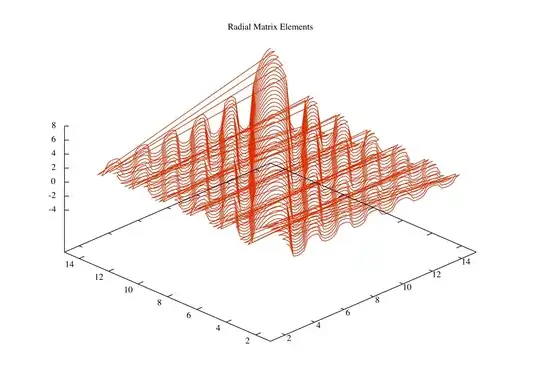
set title "Radial Matrix Elements"
set xrange [1:15]
set yrange [1:15]
set xlabel "n1*"
set ylabel "n2*"
set zlabel 'R'
splot 's1p.pun' u 1:2:4 with lines
set view 135,135 
replot

The output looks like the image below. How do i get rid of the connecting lines and get the same look as if they weren't there?

enter image description here

Rui F Ribeiro
  • 55,929
  • 26
  • 146
  • 227
user72453
  • 41
  • 2

1 Answers1

2

You can do this in the data file by putting a newline between groups of data-file-lines. Each data-file-line is the data for one value of Y (as I read the graph, the axis labeled 2,4,6,8... running from lower right to upper left). When the Y-value changes, put a blank (zero-length, extra newline) line in the data. You won't get those stray connecting lines.

For an illustration, the data file has these contents:

1 2
3 3

4 4
5 6

A gnuplot command of: plot 'data.file' using 1:2 with lines should produce two distinct line segments.