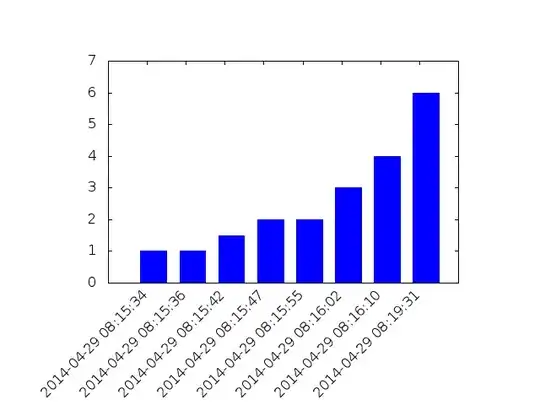
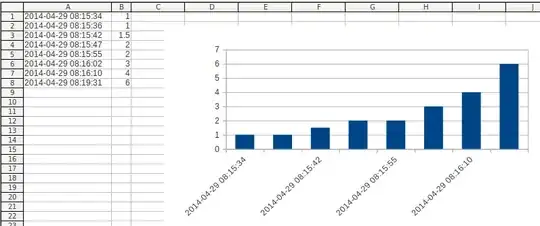
From these data I can create a diagram in OpenOffice:
$ cat time.log
2014-04-29 08:15:34 1.00
2014-04-29 08:15:36 1.00
2014-04-29 08:15:42 1.50
2014-04-29 08:15:47 2.00
2014-04-29 08:15:55 2.00
2014-04-29 08:16:02 3.00
2014-04-29 08:16:10 4.00
2014-04-29 08:19:31 6.00
$
Q: But how can we create the same diagram with a console program? Are there any diagram generator applications on Linux (using Ubuntu 12.04)? A "time.txt" can have an average 200 lines.
p.s.: these are outputs from command execution:
$ { /usr/bin/time -f "%e" sleep 6 ; } 2>&1 | sed "s/^/`date "+%F %H:%M:%S"`\t/g" >> time.log