Is there a diagram that shows how the various performance tools such as ip, netstat, perf, top, ps, etc. interact with the various subsystems within the Linux kernel?
Asked
Active
Viewed 6,941 times
59
slm
- 363,520
- 117
- 767
- 871
1 Answers
78
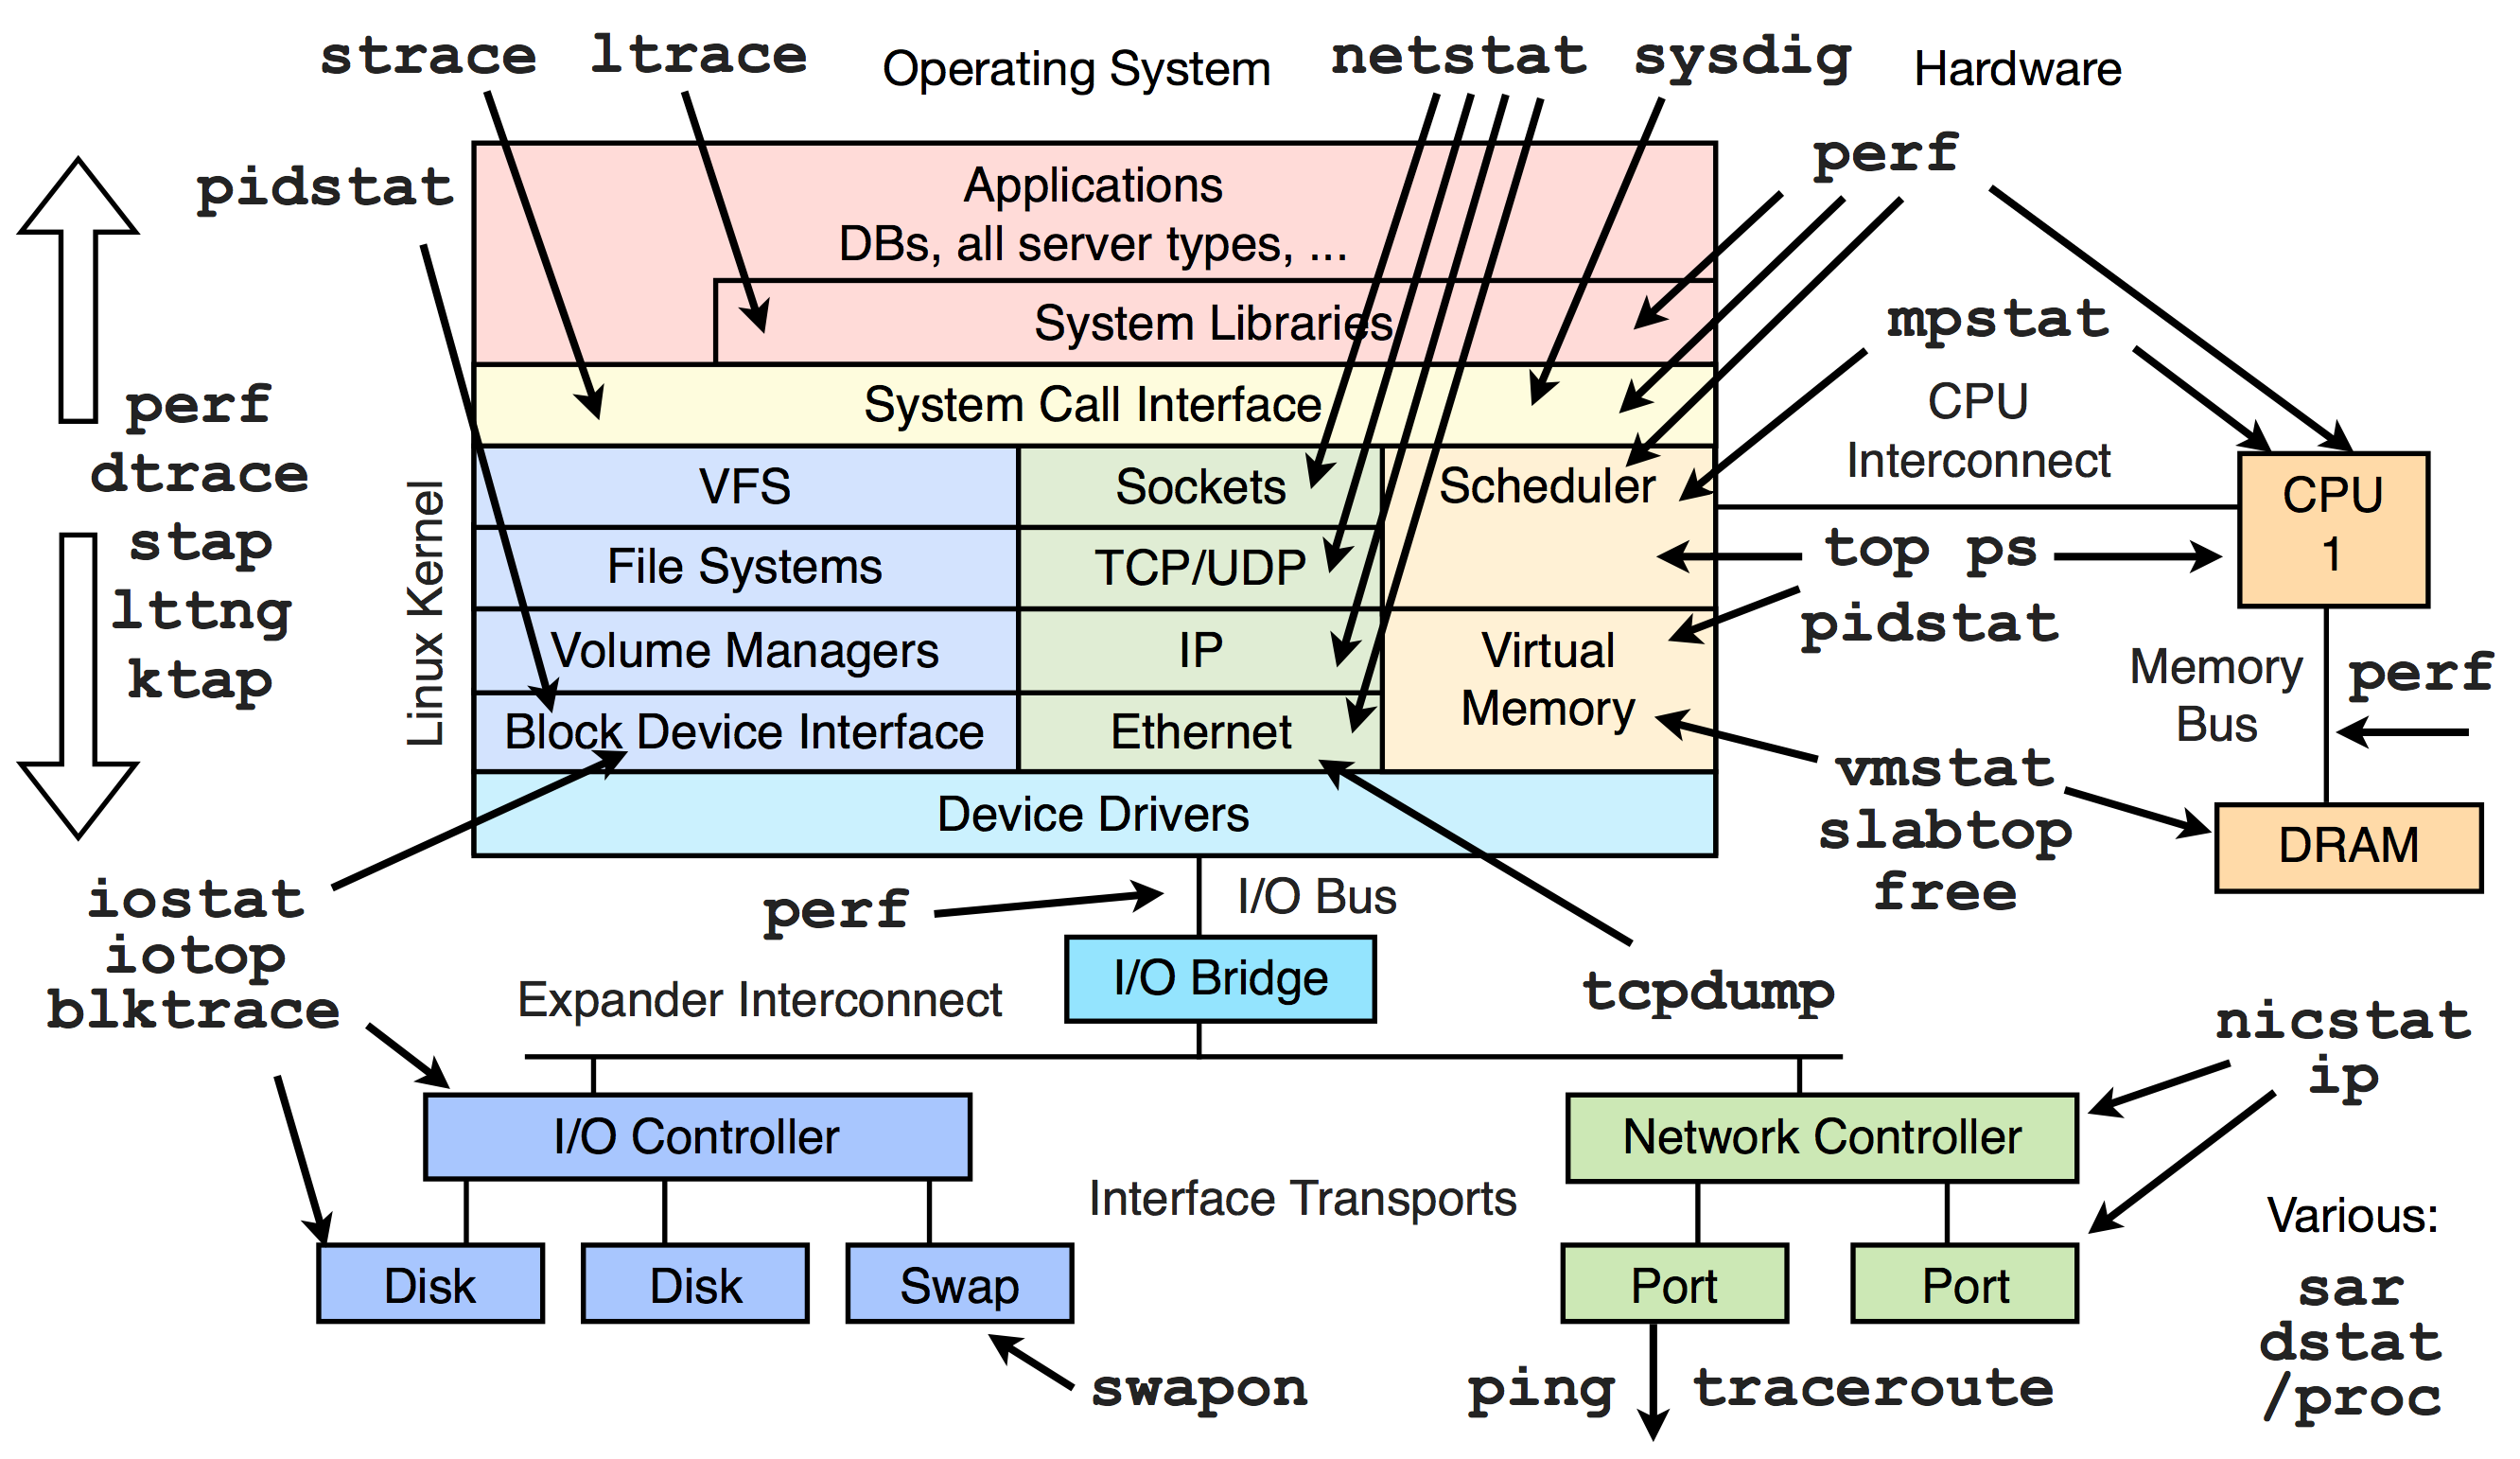
I came across this diagram which shows exactly this.

In the above you can see where tools such as strace, netstat, etc. interact with the Linux kernel's subsystems. I like this diagram because it succinctly shows where each tool latches on to the Linux kernel, which can be extremely helpful when you're first learning about all the tools and their applications.
Source: Linux PerfTools
References
slm
- 363,520
- 117
- 767
- 871
-
3there are times on this site where I'm a bit confused...as to whether to upvote the question or the answer, so when in doubt i do both! SLM, as always, appreciated – iruvar Mar 02 '14 at 07:21
-
@1_CR - kind words are always appreciated. – slm Mar 02 '14 at 07:40
-
6Just one word: awesome ! And this diagram would remain true for most Unix systems. – Ouki Mar 02 '14 at 11:04
-
It's missing `ltrace`, but nice diagram. – abligh Mar 02 '14 at 21:29
-
`ltrace` is there in the original png ('Source' at the bottom) – thameera Mar 03 '14 at 07:26
-
3Added updated image that now includes `ltrace`. – slm Mar 05 '14 at 19:57
-
1I think `mtr` belongs next to `traceroute`. – chicks Jan 16 '15 at 18:07